Investment funds and asset management market in Poland, edition 2024
Research report: Investment funds and asset management market in Poland, 2024

pdf file Investment funds and asset management market in Poland, 2024

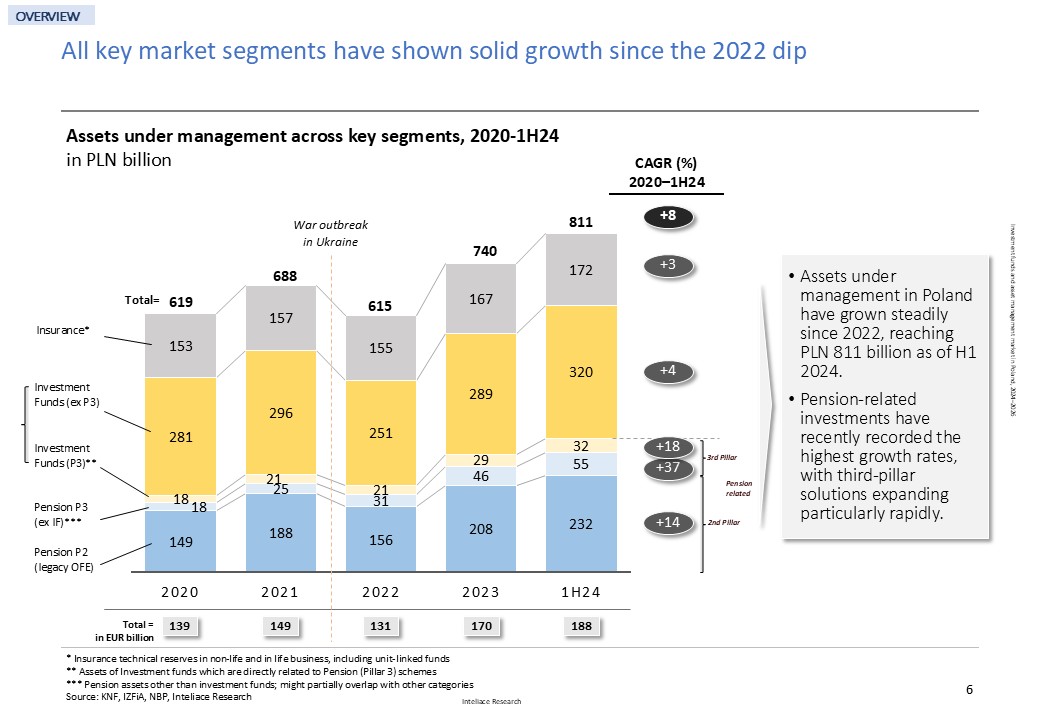
Over the past two years, the asset management sector in Poland has shown healthy growth, recovering from the contraction seen in 2022 due to geopolitical tensions following the outbreak of the war in Ukraine. Since late 2022, all key market segments have experienced consistent expansion, leading to a combined total* of PLN 811 billion (EUR 188 billion) in assets under management (AuM) by the first half of 2024. Investment funds remain the dominant segment, with AuM of PLN 352 billion, followed by second-pillar pension funds (OFE) at PLN 232 billion, and insurance companies’ reserves at PLN 172 billion.

The most dynamic growth has been observed in third-pillar pension funds, which reported a remarkable increase in AuM, reaching PLN 55 billion (excluding PPK) as of June 2024. Market leadership in the asset management industry is concentrated among a few key players. PZU holds the leading position, managing PLN 163 billion in assets and capturing a 21% market share. Allianz follows with AuM of PLN 97 billion and a 13% share. Two mid-tier players, Nationale Nederlanden and PKO, each command approximately 9% of the market. Collectively, the top four players account for over 52% of the total market share, highlighting the fairly consolidated nature of the industry.

Poland has the largest investment funds sector in Central and Eastern Europe, with over 86 billion EUR in assets under management (AuM). Recently, the growth of fund assets in Poland has accelerated, and the country's share of the region's AuM exceeded 45% in 3Q 2024. However, despite having the highest market value, Poland still lags behind some of its peers in terms of asset value per capita and assets relative to GDP.

The outlook
The asset management market, which includes three main segments—investment funds, insurance reserves, and pension assets—is expected to grow by more than 25% between the first half of 2024 and 2026. By December 2026, total assets under management (AuM) are projected to exceed PLN 1 trillion, with particularly strong growth anticipated for pension assets.


*key categories included: Investment funds, Insurance assets, Pension assets (2nd and 3rd pillar); Excluded are bank and structured deposits, equities, and bonds held directly


--------------------------------------------------------------------------------------------------------------------------------------


Table of contents


1. Executive Summary
2. Asset Management Market
Slide 1: Asset management market in Poland: Key Segments, 2Q 2024
Slide 2: Assets under management evolution by segment, 2020-2Q 2024
Slide 3: Top asset managers (groups) by AuM, 2Q/3Q 2024
3. Investment Funds
Slide 4: CEE 8 Investment fund industry – size vs. growth matrix, 2023-3Q24
Slide 5: CEE investment funds penetration benchmarks, 3Q24
Slide 6: Evolution of assets by type of fund (open, closed, etc.), 2020–3Q24
Slide 7: Number of fund managers and number of funds, 2020–2Q24
Slide 8: Asset mix (for open, and for closed funds), 2021 & 3Q24
Slide 9: Top 10 players in investment fund market, 3Q24
Slide 10: Market share evolution of top fund managers, 2021-3Q24
Slide 11: Top fund managers by client count, 3Q24
Slide 12: Top fund managers by new sales, 1H24
Slide 13: Fund sales/distribution platforms, 2024
Slide 14: Investment fund assets flows, 1Q20-4Q24
Slide 15: Asset flows, 1H24 - Top selling retail funds, 1H24
Slide 16: Fund assets structure by: dominating asset class, dedication, geo- scope, open vs. closed, 3Q24
Slide 17: Ownership of funds by groups (retail/financial/other), 2020-2Q24
Slide 18: Structure of Personal Financial Assets (PFA). The share of Investment funds within total savings of households, 2019-2Q24
Slide 19: Value of deposits, cash & investment funds held by households outstanding value, 2019-1H24
Slide 20: Fees and commissions charged by top fund managers, Dec. 2024
Slide 21: Profitability tree for fund managers (ratios), 2021-1H24
Slide 22: Revenues and costs of fund managers (values), 1H24
Slide 23: Top players' profiles - Ipopema TFI
Slide 24: Top players' profiles - PKO TFI
Slide 25: Top players' profiles - PZU TFI
Slide 26: Top players' profiles - Goldman Sachs TFI
Slide 27: Top players' profiles - Pekao TFI
Slide 28: M&A transactions including fund managers in Poland
4. Pension Funds
Slide 29: Composition of the pension sector (2nd and 3rd Pillar)
Slide 30: Pillar II: (OFE) - Assets, members, managers 2020-2Q24
Slide 31: Pillar II: (OFE) - Managers profitability tree, 2021-3Q24
Slide 32: Pillar III - Summary, all products 3rd pillar products, 2021-1H24
Slide 33: Pillar III: (PPK) - assets, members, managers, 2020-1H24
5. Insurance Assets
Slide 34: Technical reserves by type evolution, 2020-1H24
Slide 35: Technical reserves by segment (life/nl) and by company, 2023
Slide 36: Profitability of non-life insurers, 2020-1H24
Slide 37: Profitability of life insurers, 2020-1H24
6. Forecasts
Slide 38: Asset Management Market: Mid-term forecast for assets:
investment fund assets, pension assets (p2, p3), insurance investments, 2024-2026F
7. Notes on methodology
End of report.