
About this report
In 2013, Poland's GDP growth rate dropped to 1.6% YoY, which was the lowest rate since 2009. Slowing consumer demand and depleting inventories were reducing the GDP growth rate while a healthy growth in exports and a positive balance in foreign trade had a positive contribution. In response to slowing economy, and in-line with global trends, the monetary policy of the Central Bank became looser in 2013 and interest rates were reduced to the lowest levels in modern history of the country. As a consequence of recent economic developments, the insurance sector slowed down with life premium sinking by 14% YoY and non-life premium increasing just by a fraction. The fall in life insurance premium could be attributed almost exclusively to plunging sales of single premium deposit-like products, which became less attractive due to lower interest rates. Other types of saving/investment products, especially unit-linked insurance were unaffected and continued to grow in 2013 reflecting relatively stable financial condition of households and high propensity to save for retirement. Within the non-life business, car insurance suffered from falling premiums (-5% YoY) due to persisting fierce competition among insurers while property, accident and corporate insurance recorded a moderate growth in premiums. For more information on recent developments in the Polish insurance sector, please refer to the full publication.
Table of contents
More on insurance
See all →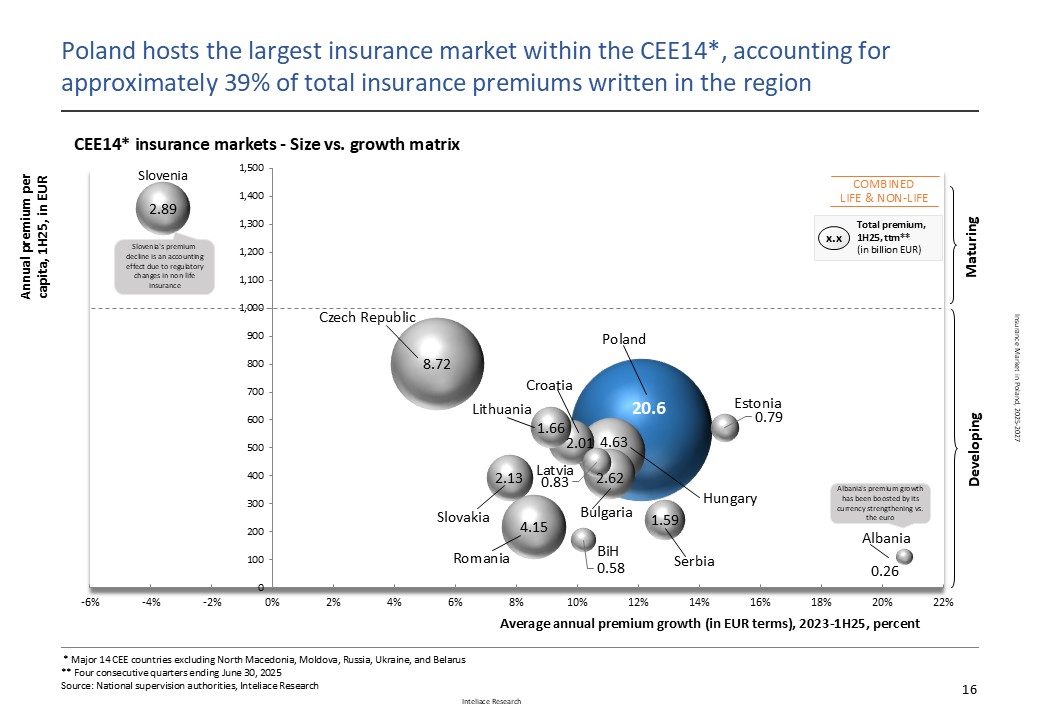
Insurance market in Poland, 2025-2027
Poland's insurance market continues to demonstrate exceptional resilience and growth potential, according to the latest comprehensive analysis from Inteliace Research. Despite broader economic uncertainties, the sector is capitalizing on the country's position as one of the EU's fastest-growing economies, with total insurance premiums estimated to surpass PLN 90 billion (€21 billion) by end-2025. The Polish economy's remarkable 2.9% GDP growth in 2024, with projections accelerating to 3.2-3.6% in 2025, provides a solid foundation for insurance sector expansion. Recovering consumption patterns, moderating inflation now at 2.9%, and rising wage levels are creating favorable conditions for both life and non-life insurance growth. Market dynamics reveal interesting competitive shifts. While PZU maintains its dominant position with 44% and 27% market share in life and non-life segments respectively, mid-tier competitors like Warta (Talanx) are gaining ground through organic growth strategies, notably surpassing PZU in the large motor TPL segment. The non-life segment continues outperforming expectations, projected to reach PLN 66 billion (€15.5 billion), significantly outpacing the life segment at PLN 24.5 billion (€5.7 billion). Digital transformation is reshaping distribution channels, with price comparison platforms expanding rapidly and providing enhanced consumer choice while intensifying competition. Corporate agents and multi-agents now account for the largest sales volume portion, while direct insurer distribution gradually declines in importance. Looking ahead, the medium-term outlook through 2027 remains highly favorable. Strong private consumption, investment activity, and wealth accumulation support new premium growth, with combined life and non-life premiums forecast to exceed PLN 103 billion (€24+ billion) by 2027. Poland's commanding 39% share of the Central and Eastern Europe insurance market, valued at ~€53 billion, underscores its regional significance. For more information on recent developments in the Polish insurance sector, please refer to the full publication.
Insurance market in Poland, 2024-2026
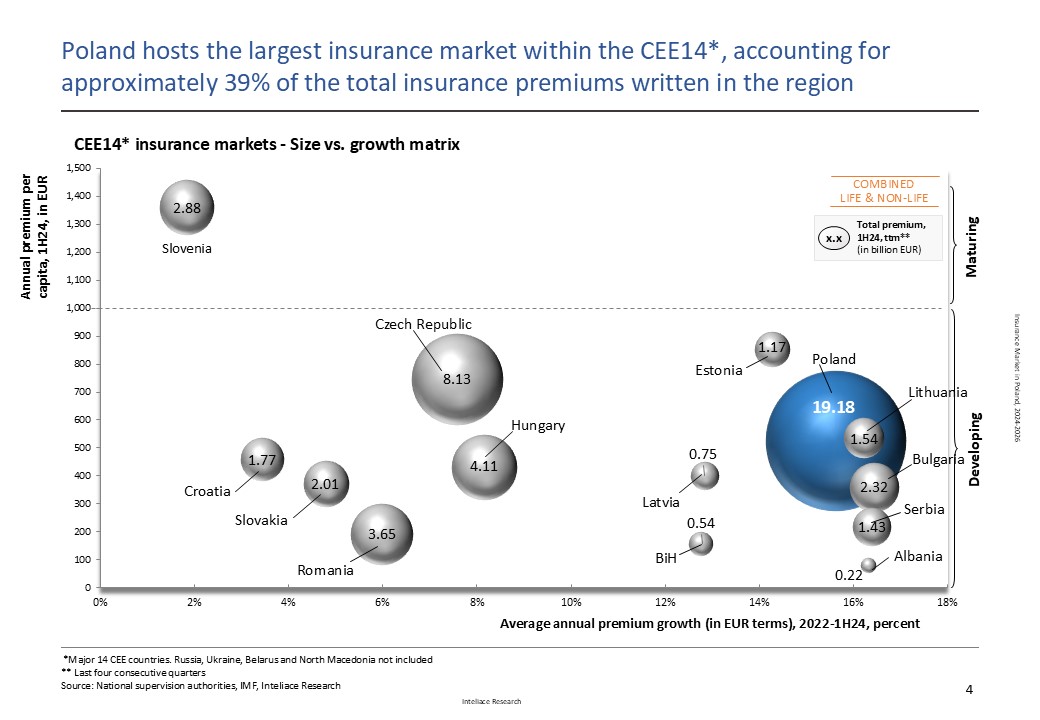
As of H1 2024, Poland, with nearly €19.2 billion in gross written premiums (GWP), accounted for approximately 39% of the total regional premium in Central and Eastern Europe. (CEE14*) Poland’s insurance sector experienced solid premium growth in 2023, with these trends continuing through the first half of 2024. The non-life segment performed particularly well, with premiums increasing by 12% year-on-year in H1 2024. In the life insurance segment, growth was lower but still significant, with premiums rising nearly 5% on an annual basis. Consistent with long-term trends, a small number of top insurers continue to expand their market share, while the collective share of smaller players is declining. This trend is likely driven by recent mergers and acquisitions (M&A) and the economies of scale enabling larger insurers to offer more competitive rates. The mid-term outlook for premium income remains positive. Projections suggest that from 2024 to 2026, the nominal growth of gross written premium (GWP) will remain stable, albeit slightly below historical averages, at approximately 8% for the non-life segment and 5% for the life segment. By 2026, combined life and non-life insurance premiums are expected to exceed PLN 98 billion (EUR 23+ billion). For more information on recent developments in the Polish insurance sector, please refer to the full publication.
Insurance market in Poland, 2023-2025
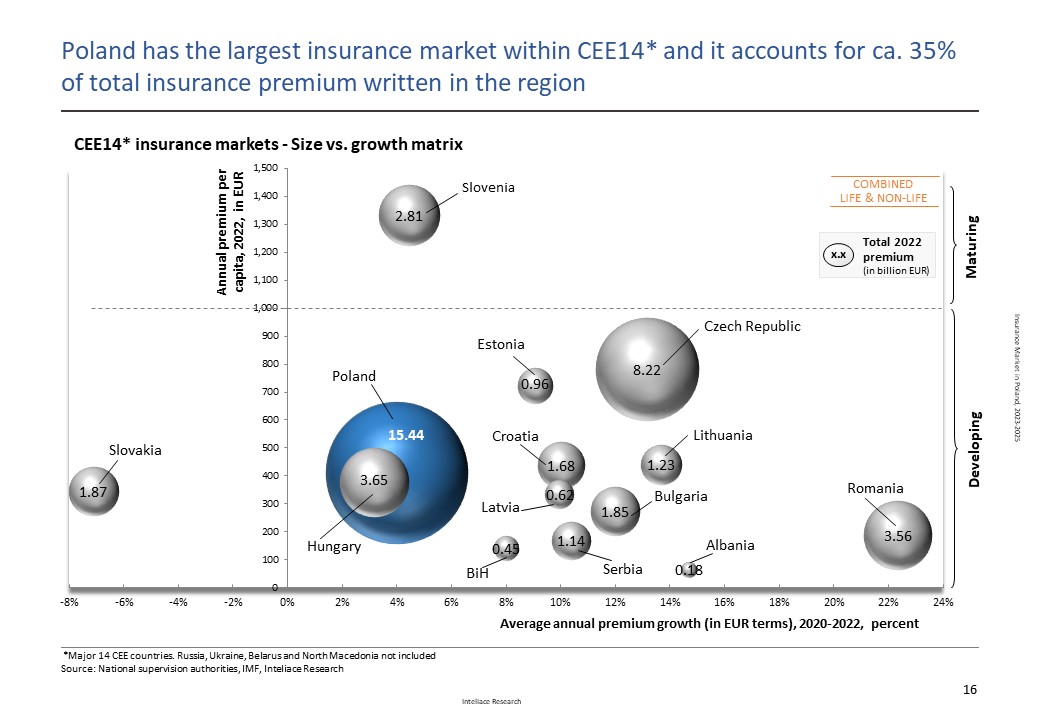
As of 2022, Poland had the largest insurance sector in CEE14 (Central and Eastern Europe*) with nearly € 15.4 billion in premium written p.a. and a 35 % share in the region. The insurance sector in Poland is undergoing a gradual evolution, with consolidation being one of key processes. Recently, a few players decided to leave the market and a number of M&A deals have been closed. Prominent transactions include the acquisition of Aegon by VIG, the acquisition of Aviva by Allianz, and the integration of MetLife by Nationale Nederlanden. Through consolidation, mid-sized insurers are able to scale up their operations and enhance profitability in the face of rising costs, required investments, and tariff pressures. Consolidation within the sector presents various benefits. It allows companies to achieve economies of scale, expand their customer base, enhance their product portfolios, and improve operational efficiency. Additionally, consolidation supports the development of stronger, more financially resilient players capable of meeting the evolving needs of policyholders. The outlook for insurers in terms of premium income is predominantly positive. By 2025, the combined premium written for life and non-life business in Poland is likely to top EUR 20 billion. However, while premium income is projected to accelerate in the mid-term, insurers' profitability is likely to stagnate. Insurers will need to make substantial investments to effectively defend their profitability. For more information on recent developments in the Polish insurance sector, please refer to the full publication.